Google Analytics is a robust, widely and more importantly FREE & PAID tool offered by Google tool for measuring the traffic and the success of your website. The tool can provide in-depth insights into the website and traffic flow and other data. The tool is very powerful and can see data across many layers, filters and across different time periods.
Analyzing the website traffic will help you give you a glimpse into visitors’ demographics (age, location & more ) and how they are interacting with the website, which pages they like, which pages they skip. This critical information can be helpful in updating the website.
In this blog post, we will share some tips and ideas on how to use Google Analytics tools to get more out of the tool.
Let’s start at the top.
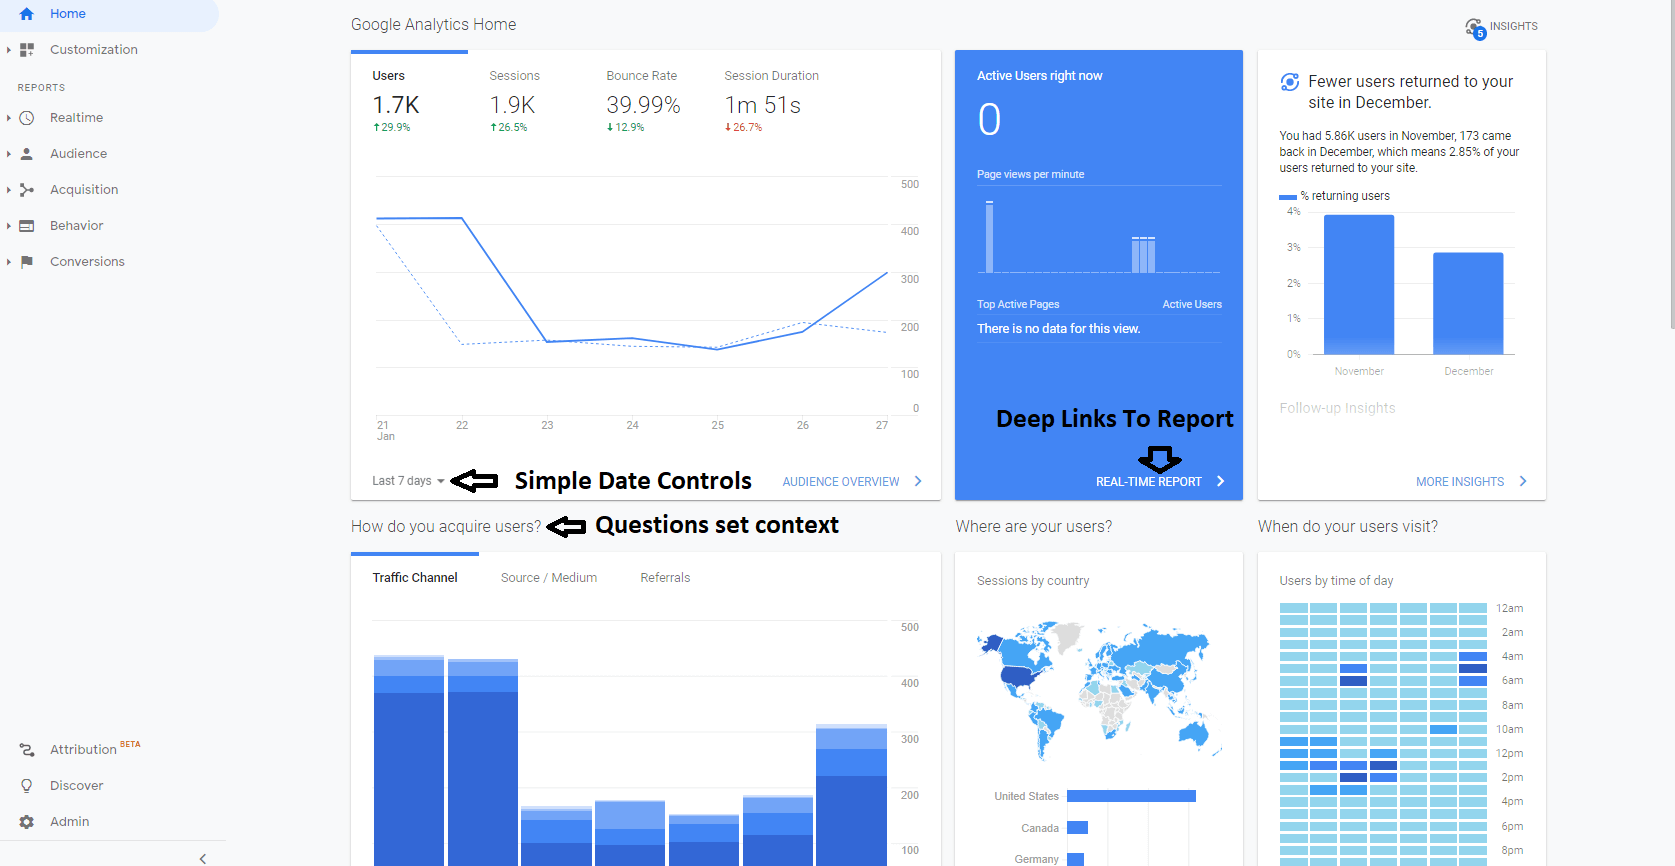
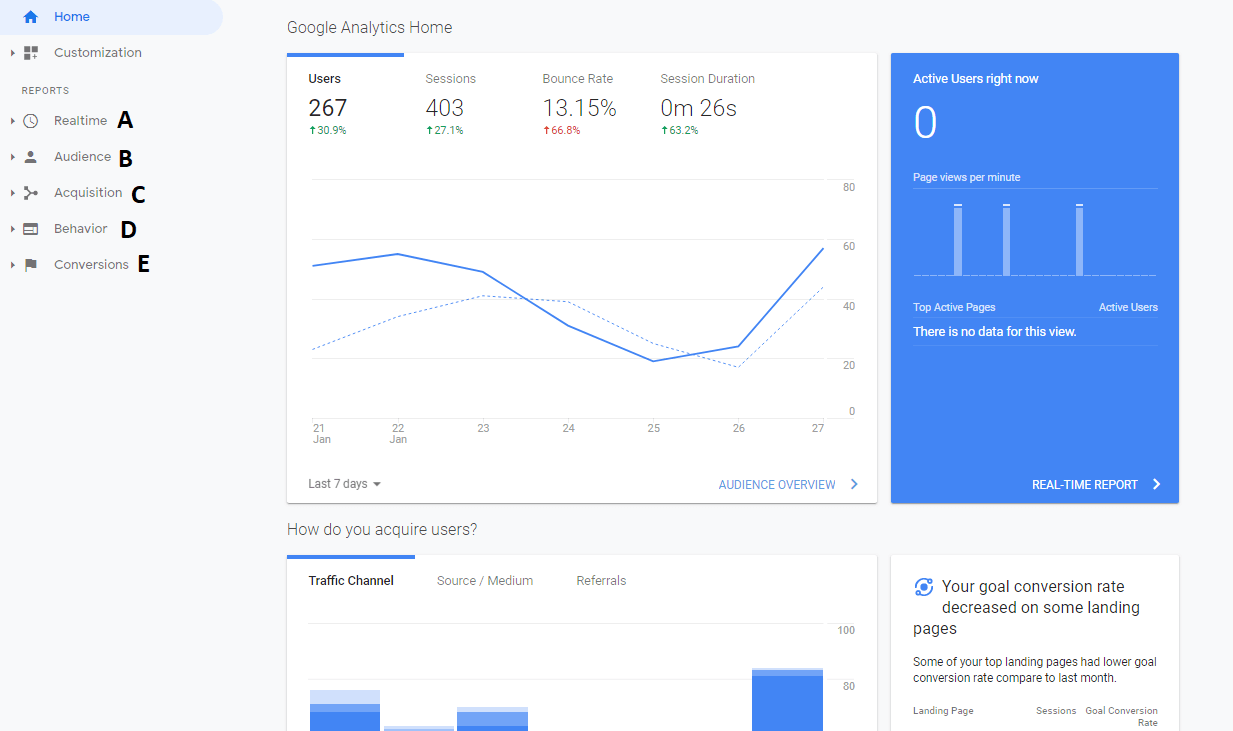
Google Analytics Home
When you log in to Google Analytics Home page gives you a summary.
The first row of cards shows you:
- Overall traffic and conversions (Users, Sessions, Bounce Rate & Sessions Duration). For more information, click a metric to change the graph.
- The current number of users on your site right now, and which pages they’re viewing.
- It’s the Follow-up Insights which shows the %returning users of November & December Month.
The second row of cards shows you:
- It shows the traffic channel (Organic, Paid, Direct, Display, Referral, Email & Other).
- The user indicated by the country, which is the top user (USA, Canada & Other).
- Give you the specific ideas of the user by time of day.
Reports Menu
This allows you to monitor activity with your website or app in real-time. Find out what are the top active pages, what top referrals, what top social traffic and much more.
The Audience reports provide in-depth of your user’s report. Look at the top device & browser of your visitor’s access to your website or app, what are they Language & Location, check the daily active user and many more.
Look at the Acquisition reports to discover how users arrive at your web site or app. It gives you a quick view of the top channels (Organic Search, Direct, Referral & More), sending visitors to your website.
It gives you an understanding of how users interact with your site or app. Understand the View data on exit pages, site search, site speed, content drilldown & other metrics.
How many conversion events were driven by marketing (e.g., sign-up completed for your email newsletter or Thank you page completed) that is important to the success of your business?
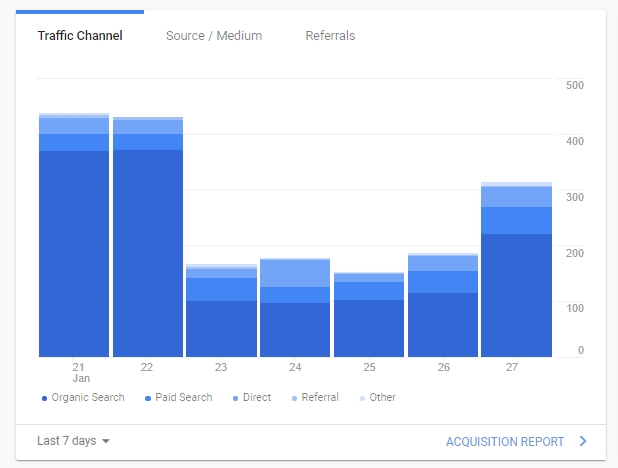
How do You Acquire Users?
Top traffic sources from all channels combined. It shows the most effective channel and allows you to focus your marketing efforts to target the more traffic through that channel. The marketing campaigns that are not performing optimally can be tweaked for better ROI. They are listed based on the number of visitors between Jan21 to Jan 27 sent to the website.
Audience Reports
The date range is the last 90 days. The three Audience reports can help inform your content & user strategy. What are most of the country user come from, what are the specific timings by day & which top device they use?
Understanding Where Your Website Traffic?
The date range is between Jan21 to Jan 27 before we talk about channels. First essential to understand the difference between sources & mediums.
Source: Where your website’s traffic comes from (individual websites, Google, Facebook, Bing & more).
Medium: How it got there (Organic traffic, Paid traffic, Referral, Email & more).
You can find data and insights into traffic acquisition in the Google Analytics Acquisition tab. Select Acquisition → Overview from the left-hand menu. These reports will give you proper insight into whether your marketing strategies are working.
For example, if you’ve been focusing on organic search, you should look for the right amount of traffic from Organic and make the new strategies for the same to increase the traffic.
If you want to see in-depth information on how your visitors are coming from and how this traffic from individual source is engaging with your site, select Acquisition → All Traffic → Channels and understand the metric carefully and make the strategies according to your site traffic increase.
Essential To Know New vs. Returning Visitors
The date range is between Jan 01 to Jan 28. New Visitors: Are people to your site for the first time are coming to your website/ app.
Returning Visitors: People have visited your website before and are back for more!
To check the metric, Select Audience → Behavior → New vs Returning and understand the metric carefully & target the new or returning audience according to your business perspective.
Don’t Know About Top Devices?
The date range is between Jan 01 to Jan 28. Check the stats on devices used can be seen under the Audience → Mobile → Overview.
This is the device segment of users by the specific desktop, mobile & tablet device which they are using. Here you’ll get the idea for the user about the top device.
Below are the cmsMinds site desktop & Mobile screenshot.
Desktop Speed:
If your site speed is slow, then it’s recommended to improve the site speed. Fixing the functionality will improve the site speed which would affect the bounce rate and overall performance for the website. Contact our expert team of the desktop or mobile speed issue of your site.
Final Thoughts
Google Analytics can be an extraordinarily successful way to track your website’s or app performance.
I hope you’ve enjoyed this 2021 How to Use Google Analytics Interface. Have some burning questions/ queries, please ask in the comments box; I am happy to help you!
Want to bring in some experts to help you set up and analyze your Google Analytics data. Call us today.
If you are interested in learning more about some of the individual technologies, read the following articles:
Ultimate Guide: How To Migrate Drupal 7 To Drupal 8
Top 10 Simple Tips To Secure WordPress Site